May 11, 2009
Ioan Alin Nistor, Mukul Pal
Assistant Professor, Faculty of Business, “Babes-Bolyai” University, Romania, e-mail: ioan.nistor@tbs.ubbcluj.ro. (神戸大学の日本学術振興会 外国人特別研究員)
Head of Research, Orpheus CAPITALS, The Global Alternative Research Company, e-mail: mukul@or-phe-us.com
Starting with the fundamental idea of an “emerging market economy”, it’s role, utility and dynamics in the current global set up as a balancing economic block, the paper analysis Goldman Sach’s emerging BRIC’s countries model in context of the pre and post 2008 financial crisis. The paper looks at micro and macroeconomic valuations, currency and the economic cycles to illustrate changes in the four economies. Using Japan as a developed economy, the paper also makes a comparative approach and tries to forecast the economic development of the block and respective relation among these countries.
Key words: emerging markets, BRIC’s countries, economic cycles
Overview
Emerging market is sometimes loosely used as a replacement for emerging economies, but really signifies a business phenomenon that is not fully described by or constrained to geography or economic strength; such countries are considered to be in a transitional phase between developing and developed status.
The “emerging market” concept is not very clearly defined. Although the concept of emerging seems to be widely used, it has different implications in defining which country is emerging. Kolodko (Globalization and Catching-up in Emerging Market Economies, 2003) believes that it is easier to determine which countries are not emerging market economies then it is to determine those that are.
Determining the emerging market status of an economy is a matter of establishing the openness and development of its institutions, as well as whether the economy in question adheres to the rules, laws and culture of an open-market economy. (D.K.Das. Financial Globalization and Emerging Market Economies, 2004).
The term “emerging” is widely used to describe these economies. Maybe more than any language, in Japanese language, the term “emerging” somehow defines very well the type of economy that it refers to. By using the kanji 新興which symbolized “new” and “rising”, it makes it a bit easier to picture these economies.
The International Finance Corporation (IFC), member of the World Bank Group, began using the phrase “emerging financial markets” in 1981, when they kept and published standardized stock index for a set of countries. The original list contained nine countries whose stock markets looked promising. The list was later expanded.
International Monetary Fund (IMF), in the World Economic Outlook from April 2008, explains a country classification of the WEO Groups (World Economic Outlook). WEO divides the world into two major groups: advanced economies and emerging and developing economies. More than 200 countries are included in the “emerging and developing economies” category, separated by regions.
International financial institutions or research institutes, group the emerging countries in different categories. The IIF (Institute of International Finance) divides them in four groups: Emerging Asia, Latin America, Emerging Europe and Africa/Middle East with a total of 23 countries. “The Economist” has classified 25 emerging market economies for reporting its emerging market indicators.
The BRIC Model. Review and Forecasts
A Goldman Sachs Report from October 2003 (Purushothaman & Wilson 2003, Dreaming with BRICs: The Path to 2050) projected the GDP growth, income per capita and currency movements in the BRICs economies until 2050. Using the demographic projections and a model of capital accumulation and productivity growth, the paper argues that if things go right (a series of assumptions were taken), “the BRICs economies together could be larger than the G6 in US dollar terms. By 2025 they could account for over half the size of the G6”. However, as the report suggests, there is no guarantee that the economic growth of these countries will reach what is forecasted by the study. The growth depends on a set of factors, such as macro stability (price stability), efficient institutions (legal system, functioning markets, health and education systems, financial institutions), openness to trade and FDI, and improvement in education level of the population.
Although the forecast is exposed to criticism (limited natural resources, unsustained growth or political instability) there is no doubt that due to their GDP dimension, geographic and population size, in spite of the problems that these countries face nowadays, we cannot overlook the importance and potential of these economies.
In the following analysis the authors make a comparative approach of the BRIC block with Japan, using the Stock Exchange Index of each country as a base for comparison and forecast. The indices used are:
– Japan: The Nikkei-225 (N225) Stock Average is a price-weighted average of 225 top-rated Japanese companies listed in the First Section of the Tokyo Stock Exchange.
– Brazil: The Bovespa (BVSP) Index is a total return index weighted by traded volume and is comprised of the most liquid stocks traded on the Sao Paulo Stock Exchange
– India: The Bombay Stock Exchange Sensitive Index (BSESN – Sensex) made is a market capitalization weighted index. The selection of the index members has been made on the basis of liquidity, depth, and floating-stock-adjustment depth and industry representation.
– China: The Shenzhen Stock Exchange Component (SSEC) Stock Index is a Capitalization Weighted Index.
– Russia: The Russian Trading System Index (IRTS) is a capitalization-weighted index. The index is comprised of stocks traded on the Russian Trading System and uses free-float adjusted shares.
Challenges and Conclusions
The Goldman’ BRIC model simplified 2050 vision stands challenged. The hypothesis became weak after the commodity boom started in 2000. BRICS classification broke down as the four countries delivered polarized returns. The model was clearly divided between commodity and internal growth drivers i.e. commodity price rise for Brazil and Russia and internal demand factor for India and China.
Most of the BRIC countries made a cyclical low around 1995. Brazil made a primary low in 1995, Russian RTS made a low in 1996 but retested it again making a marginal new low in 1999, the same was true for the Shanghai Index, which hit its primary base near 1995 and finally the Indian Sensex 1995 low was marginally breached. Most of these 1995 lows were followed by multi-year slowdowns. The relative alpha for BRIC markets was clear after 2000. And the Goldman report did time that, as BRICs barring Russia grew at a multiple of three times that of Dow Jones over the 2000-2007 along with the strengthening of the local currencies. But the report missed to call it a global equity bottom in 2002, and the 2000 equity meltdown and its impact on the emerging market model. The report did provide GDP projections but it did not articulate the relative attractiveness of the BRIC countries. Though the BRIC countries were mentioned as the new global engines, the impact of rising food prices on BRICs and the demographic strength could become a liability if food price increase continued unabated also found no mention.
The report was overweight on drivers like growth and productivity. If one looks at the commodity link, Russia was a disproportionate gainer in the group not just because of the growth projections from internal macroeconomic factors but because of its high weightage (64 per cent) energy export basket. We crosschecked the returns on BRICs in dollar weighted terms, gold terms and CRB Commodity Index terms for the 2000-2007 period. In actual terms, the Russian stock market grew 3.6 times more than the other BRIC countries in 2000-2007. In gold weighted terms, the multiple was 9.4 times, and in CRB weighted terms the multiple was at 5 times. In dollar weighted terms, the multiple stood at 4.6 times. This was clear evidence that it was the underlying commodity boom and not the emerging market growth factors, which were polarizing the performance among BRIC countries.
Now that the commodity cycle has come down, one needs to look at new parameters to judge performance between the BRICs and between BRICs vs. Nikkei.
We believe that unlike the last time a rise in commodity prices now may not see a similar action with both Brazil and Russia rising together. Rising commodities are not good beyond a certain level for the underlying growth. We think a reprieve in commodities this time around will benefit Russia more than Brazil and China being the world’s manufacturer will suffer more than India till 2015. We compare the entire BRIC region with N225 and observed that owing to these underlying structural problems Nikkei should outperform both China and Brazil. India and Russia on the other hand should relatively outperform Nikkei. One on side this may look strange, but as we know that tough times bring out real outperformance. Russia owing to its large energy basket and sizeable correction from historical high levels in 2008 will also benefit owing to base effect just like it benefited in 1998 after the Rouble crisis.
To bring out this performance cyclicality we have studied pair performance between the BRICs countries and Nikkei, based on three 36-40 month time horizon in the 10 -12 year larger economic cycle (Fig.1, Fig. 2, Fig. 3, and Fig. 4). We used the first derivative (rate of change indicator) of the pair lines (ratio between the prices of the two indices, black line). We could see a performance cycle formation both on long term (10-12 years) and short term (36-40 months) in the illustrated cases (marked by red). We saw most pairs deliver positive performance (Table 1, Table 2, Table 3 and Table 4) if one was positive on one country (economic zone) and negative on the other. The findings suggest that there is 10-12 year cyclical performance which should repeat till 2015 on a larger time frame and till 2009-2011 on a shorter time frame. The performance time frames were illustrated in the respective workings (vertical red lines) using half of the previous performance cycle, 5-6 years for larger time frames and 15-20 months for smaller performance time cycles.
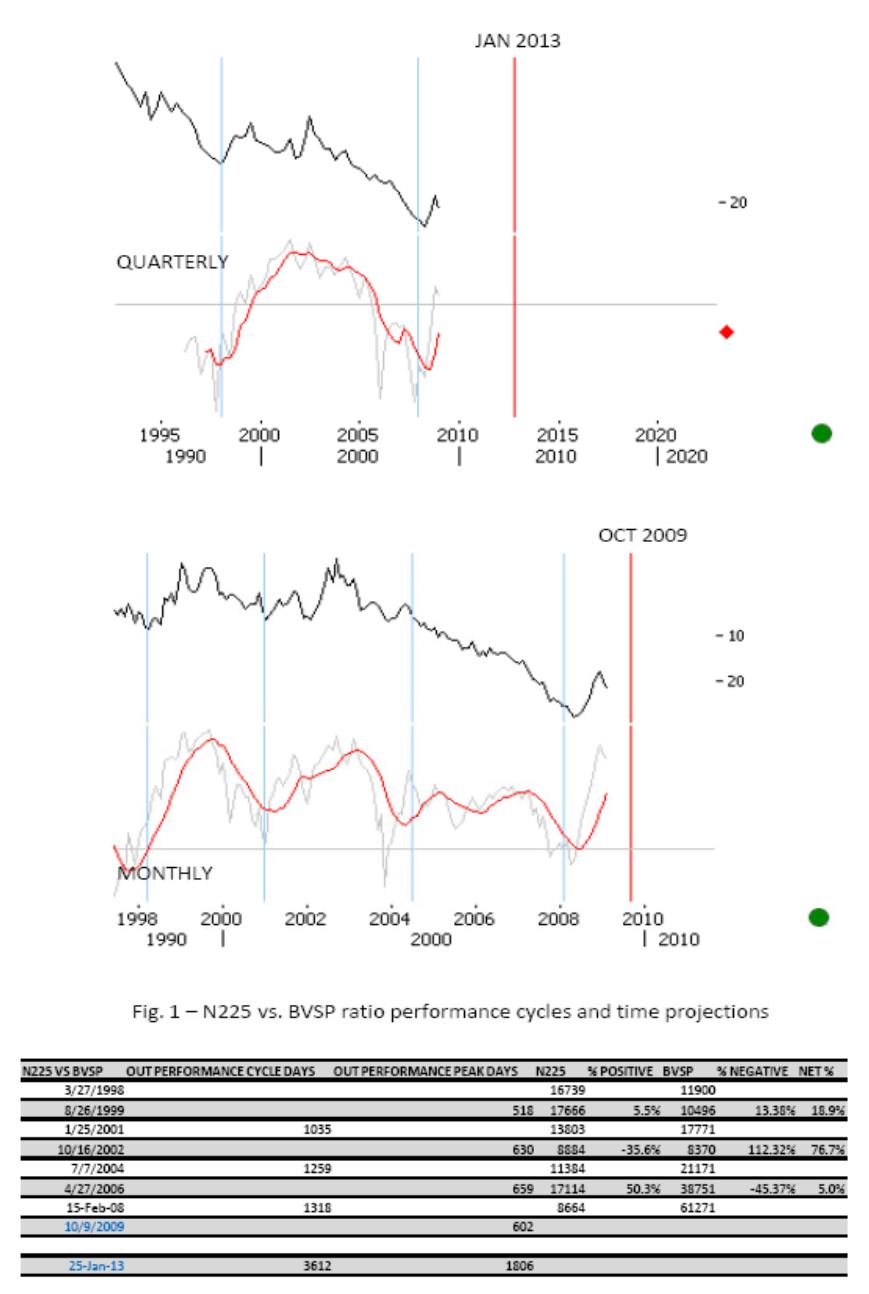
Table 1: N225 vs. BVSP Pair Positive Returns Validates Performance Cycle Time Projections.
In conclusion the authors believe that there is an intricate balance between the world order and relative outperformance against China and Brazil will keep the Japanese growth engine sustain and grow contrary to popular belief. This should also lead to both actual and relative growth in Nikkei and even the underlying GDP growth for the Japanese economic zone.
References:
– Arsentis P., Paula L.F. – Financial Liberalization and Economic Performance in Emerging Countries, Palgrave Macmillian, New York, 2008
– Beim, D.O., Calomiris C.W. – Emerging Financial Markets, McGraw Hill International Edition, Finance Series, 2001
– Das., D.K. – Financial Globalization and the Emerging Market Economies, Routledge Studies in the Modern World Economy, 2004
– Kolodko, G.W. – Emerging Market Economies (Globalization and Development), Ashgate Publishing Limited, England 2003
– Financial data provided by Thompson Reuters
Download Compete Paper from SSRN